Dashboards are only as trustworthy as the tables underneath them, and most analytics breaks quietly: a join fans out, a null slips in, a metric definition drifts between two reports. The goal here was a warehouse where a business question — who are our best customers, which products carry revenue, where is delivery slipping — is answered from a single tested source of truth, not a one-off query someone has to re-verify.
The Northwind dataset — a classic operational schema of orders, customers, products, and employees: 8 source tables, about 830 orders across 91 customers — loaded as raw seeds and modelled upward into analytics-ready marts.
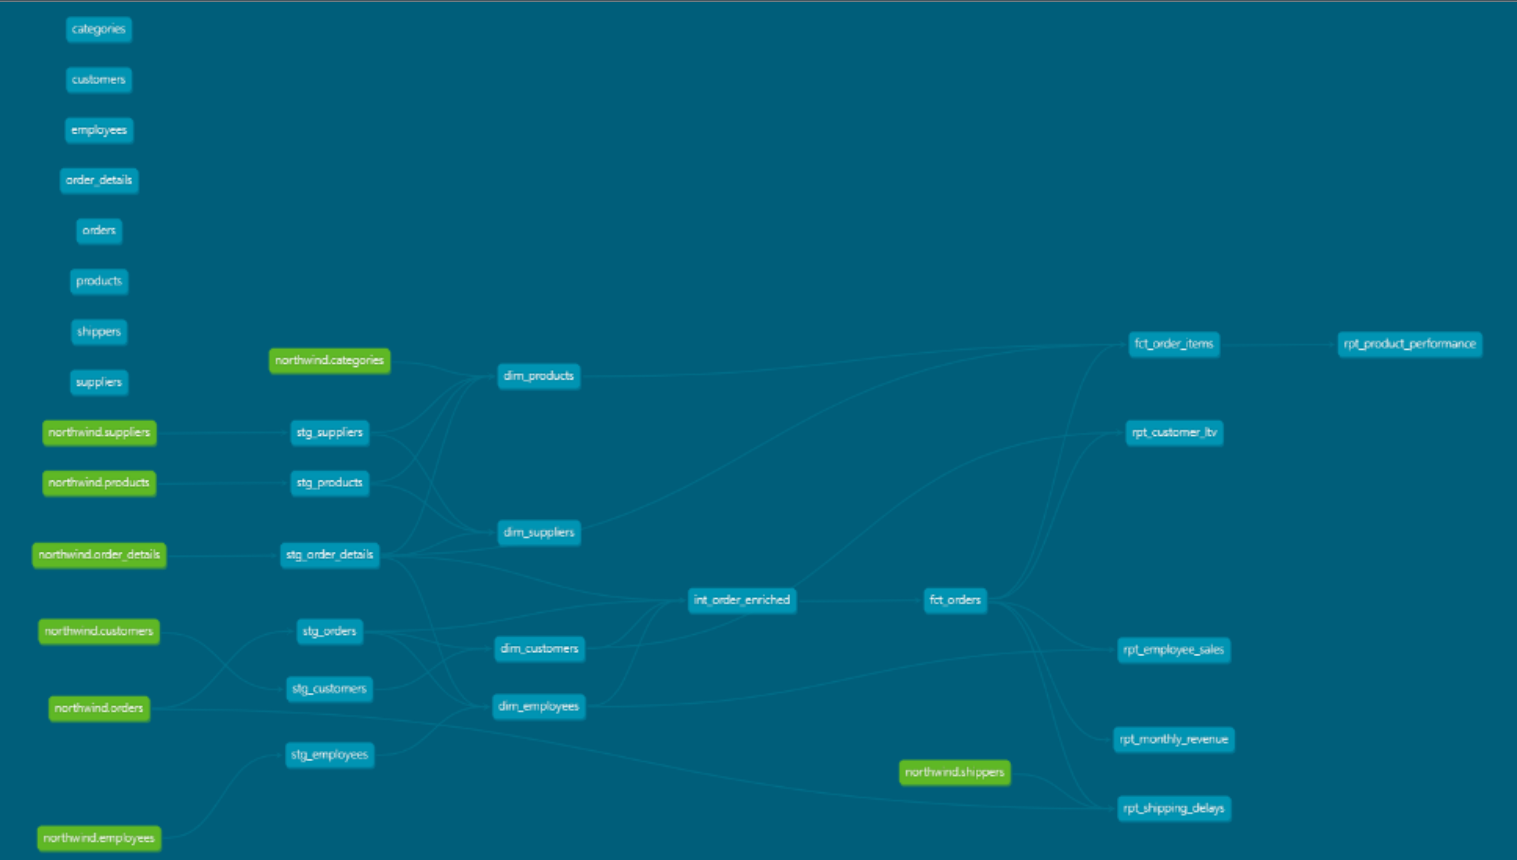
A five-layer dbt project on DuckDB: raw seeds → staging (typed, renamed, cleaned) → intermediate (joins and business logic) → a dimensional layer of facts and dimensions in a star schema → reporting marts the business actually reads. Every model carries tests — uniqueness, not-null, referential integrity, accepted values — and the whole graph is documented with a published lineage DAG.
19 models, 132 automated tests, a 100% pass rate — and from that tested layer the business signal is immediate: the top 3 customers alone carry over $319K in lifetime value, a single product (Côte de Blaye) drives $141K, and Argentina shows the weakest on-time delivery at 81%.
Because every figure traces back through tested models, none of it needs re-checking by hand.
Promote this tested layer to the single source for customer and revenue reporting, and wire the test suite into CI so a failing test blocks a bad merge before it reaches a dashboard. The regional on-time-delivery gap is the first operational thread worth pulling — it's a margin problem hiding inside a logistics metric.